Difference between revisions of "Gantt-chart-for-TLS"
| (30 intermediate revisions by 2 users not shown) | |||
| Line 1: | Line 1: | ||
= Gannt Panel For TLS = | = Gannt Panel For TLS = | ||
| − | [[File: | + | [[File:Portal.PNG|RTENOTITLE]] |
| + | |||
| + | |||
| Line 16: | Line 18: | ||
#Can set color (Red, Yellow, Green, Blue) mapping to light sensor ID (Light1, Light2, Light3, Light4) by TLS. | #Can set color (Red, Yellow, Green, Blue) mapping to light sensor ID (Light1, Light2, Light3, Light4) by TLS. | ||
#Can define timeline period on Gantt chart. | #Can define timeline period on Gantt chart. | ||
| + | #The timeline will be displayed below the Gantt chart. | ||
| + | #Gantt chart can set customize label name. | ||
| + | |||
| + | |||
| Line 31: | Line 37: | ||
| − | |||
| − | |||
| − | |||
| − | |||
| − | |||
| − | |||
| − | |||
| − | |||
| − | |||
| − | |||
| − | |||
| − | |||
| − | |||
| − | |||
| − | |||
| − | |||
| − | |||
| − | |||
| − | |||
| − | |||
| − | + | = How To Add RMM-SimpleJSON DataSource = | |
| + | Choose Configuration -> Data Source -> RMM-SimpleJson | ||
| + | [[File:Tower Light create data source1.jpg|RTENOTITLE]] | ||
| − | + | Edit settings as follow | |
| − | + | [[File:Tower Light create data source2.jpg|RTENOTITLE]] | |
| − | {| border="1" cellspacing="1" cellpadding="1" | + | {| border="1" cellspacing="1" cellpadding="1" style="width:500px;" |
|- | |- | ||
| | | | ||
Name: RMM-SimpleJson | Name: RMM-SimpleJson | ||
| − | HTTP<br/>URL: | + | HTTP<br/>URL: [http://168.63.200.38/rmm/v1/grafana/simplejson/ http://168.63.200.38/rmm/v1/grafana/simplejson/]<br/><span style="color:#FF0000;">* Notice: you need to change url for your EdgeSense url . For example, [https://edgesense.wise-paas.com/rmm/v1/grafana/simplejson/ https://edgesense.wise-paas.com/rmm/v1/grafana/simplejson/]</span> |
| + | |||
| + | Access: Server (default) | ||
Auth<br/>Basic Auth : V | Auth<br/>Basic Auth : V | ||
| Line 75: | Line 65: | ||
|} | |} | ||
| − | |||
| − | |||
| Line 84: | Line 72: | ||
= How To Create A New Gantt Panel = | = How To Create A New Gantt Panel = | ||
| − | Step 1: Add panel and choose plugin "Gantt-for-TLS" see Figure | + | Step 1: Add panel and choose plugin "Gantt-for-TLS" see Figure 1. |
| − | Step 2: Edit panel see Figure | + | Step 2: Edit panel see Figure 2. |
Step 3: Set up Metrics and choose DataSource "RMM-SimpleJson". | Step 3: Set up Metrics and choose DataSource "RMM-SimpleJson". | ||
| − | Step 4: Set up all of the sensor's(Light1、Light2、Light3、Light4) "Device" "Plugin" "Sensor" "Alias" see Figure | + | Step 4: Set up all of the sensor's(Light1、Light2、Light3、Light4) "Device" "Plugin" "Sensor" "Alias" see Figure 3. |
<span style="color:#FF0000;">*Warning: Although the sensor light can define the mapping color but the aliases must be these strings "red" "yellow" "green" "blue".</span> | <span style="color:#FF0000;">*Warning: Although the sensor light can define the mapping color but the aliases must be these strings "red" "yellow" "green" "blue".</span> | ||
| Line 99: | Line 87: | ||
[[File:TLS-Panel.PNG|RTENOTITLE]] | [[File:TLS-Panel.PNG|RTENOTITLE]] | ||
| − | (Figure | + | (Figure 1 、 Add Panel) |
| Line 107: | Line 95: | ||
[[File:TLS-EditButton.PNG|RTENOTITLE]] | [[File:TLS-EditButton.PNG|RTENOTITLE]] | ||
| − | (Figure | + | (Figure 2 、 Edit Panel) |
| Line 115: | Line 103: | ||
[[File:TLS-Metrics.PNG|RTENOTITLE]] | [[File:TLS-Metrics.PNG|RTENOTITLE]] | ||
| − | (Figure | + | (Figure 3 、 Set Metrics) |
| − | |||
| − | |||
| − | |||
| − | |||
| − | |||
| − | |||
| − | |||
| − | |||
| − | |||
| − | |||
| − | |||
| − | |||
| − | |||
| − | |||
| + | = Customizable = | ||
| + | <span style="font-size:large;">Options</span> | ||
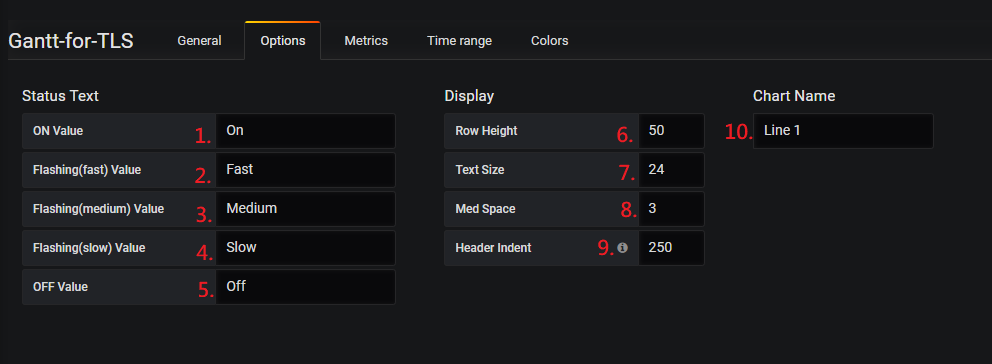
| + | *You can set up the status text from option1~option5 from Figure 5 . | ||
| + | *You can set up the label text from option10 from Figure 6 . | ||
| + | *"Row Height option6" can change panel's heigh. | ||
| + | *"Text Size option7" can change status text's size. | ||
| + | *"Med Space option8" can Change the distance between Label and Status. | ||
| + | *"Header Indent option9" can change the header's width. | ||
| + | [[File:Tls-opt-v2.PNG|RTENOTITLE]] | ||
| + | (Figure 4 、 Options Step) | ||
| + | [[File:Status-v2.PNG|RTENOTITLE]] | ||
| + | (Figure 5 、 Status Text) | ||
| + | [[File:Label-v2.png|RTENOTITLE]] | ||
| + | (Figure 6 、 Label Text) | ||
| + | <span style="font-size:large;">Colors</span> | ||
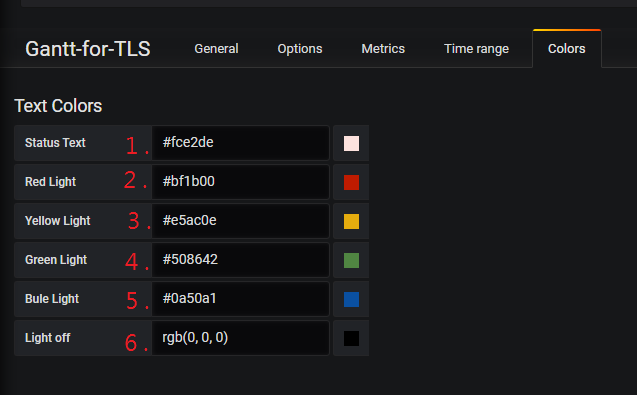
| + | *"Status Text" can change status text's color from 1 see Figure 7 . | ||
| + | *"Red/Yellow/Green/Blue Light" can change light's color from 2 ~ 6 see Figure 7 . | ||
| + | [[File:TLS-color.PNG|RTENOTITLE]] | ||
| + | (Figure 7 、 Colors Mapping) | ||
| − | + | = Export CSV File = | |
| − | |||
| − | = | ||
<span style="font-size:large;">Options</span> | <span style="font-size:large;">Options</span> | ||
| − | * | + | *Please select the appropriate time range see Figure 8 . |
| − | * | + | *Click the Export CSV see Figure 9 . |
| − | |||
| − | |||
| + | [[File:Grafana Timerange.PNG|RTENOTITLE]] | ||
| + | (Figure 8 、 Grafana Time Range) | ||
| − | [[File: | + | [[File:Grafana Exportcsv2.PNG|RTENOTITLE]] |
| − | |||
| − | |||
| − | (Figure 9 、 | + | (Figure 9 、 Export CSV) |
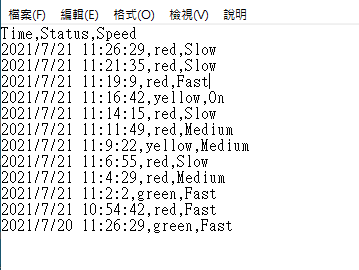
| − | + | <span style="color:#FF0000;">** Notice **</span> | |
| − | + | <span style="color:#FF0000;">It will be recorded when the status changes</span> | |
| − | |||
| − | [[File: | + | [[File:Grafana Csv.PNG|RTENOTITLE]] |
| − | + | (Figure 10 、 CSV File Example) | |
| + | = Release = | ||
| + | {| border="1" cellspacing="1" cellpadding="1" style="width: 546px;" | ||
| + | |- | ||
| + | | style="width: 36px;" | Index | ||
| + | | style="width: 54px;" | Version | ||
| + | | style="width: 78px;" | Date | ||
| + | | style="width: 56px;" | OS<br/> | ||
| + | | style="width: 188px;" | Release Note<br/> | ||
| + | | style="width: 101px;" | Download Link<br/> | ||
| + | |- | ||
| + | | style="width: 36px;" | 1 | ||
| + | | style="width: 54px;" | 1.0.0 | ||
| + | | style="width: 78px;" | 2019-11-1 | ||
| + | | style="width: 56px;" | windows | ||
| + | | style="width: 188px;" | First Release<br/> | ||
| + | | style="width: 101px;" | | ||
| + | [file://EOSSFS/ESS-Release/EdgeSense/Release/Windows/EnOcean/Gannt-Chart-For-TLS/Release/1.0.0/grafana-plugin/grafana-plugin.zip [1]] | ||
| − | + | |- | |
| + | | style="width: 36px;" | 2 | ||
| + | | style="width: 54px;" | 1.0.1 | ||
| + | | style="width: 78px;" | 2020-2-3 | ||
| + | | style="width: 56px;" | windows | ||
| + | | style="width: 188px;" | | ||
| + | Add two Feature | ||
| + | 1. Med Space | ||
| + | 2. Header Indent | ||
| − | = Release | + | | style="width: 101px;" | |
| + | [file://EOSSFS/ESS-Release/EdgeSense/Release/Windows/EnOcean/Gannt-Chart-For-TLS/Release/1.0.1/grafana-plugin/grafana-plugin.zip [2]] | ||
| − | + | |- | |
| + | | style="width: 36px;" | 3 | ||
| + | | style="width: 54px;" | | ||
| + | 1.0.2 | ||
| − | + | | style="width: 78px;" | 2021-7-22 | |
| − | |- | + | | style="width: 56px;" | windows<br/> |
| − | + | | style="width: 188px;" | Add export csv | |
| − | + | | style="width: 101px;" | [file://EOSSFS/ESS-Release/EdgeSense/Release/Windows/EnOcean/Gannt-Chart-For-TLS/Release/1.0.2/grafana-plugin/grafana-plugin.zip [3]]<br/> | |
| − | |||
| − | | style="width: 56px;" | | ||
| − | | style="width: | ||
| − | | style="width: | ||
| − | |||
| − | |||
| − | |||
| − | |||
| − | |||
| − | |||
| − | |||
| − | |||
| − | |||
|} | |} | ||
| − | |||
Latest revision as of 04:27, 23 August 2021
Contents
Gannt Panel For TLS
Introduction
This is a customized Gantt chart for the TLS project. The diagram has following features.
- Can gets TLS data in period and shows color bar with priority display rule.
- Can set customize status text from option.
- Direction of time axis: from Left (past) to Right (present).
- Can set color (Red, Yellow, Green, Blue) mapping to light sensor ID (Light1, Light2, Light3, Light4) by TLS.
- Can define timeline period on Gantt chart.
- The timeline will be displayed below the Gantt chart.
- Gantt chart can set customize label name.
Grafana Version
This Project is base on Grafana v5.3.0 .
How To Add RMM-SimpleJSON DataSource
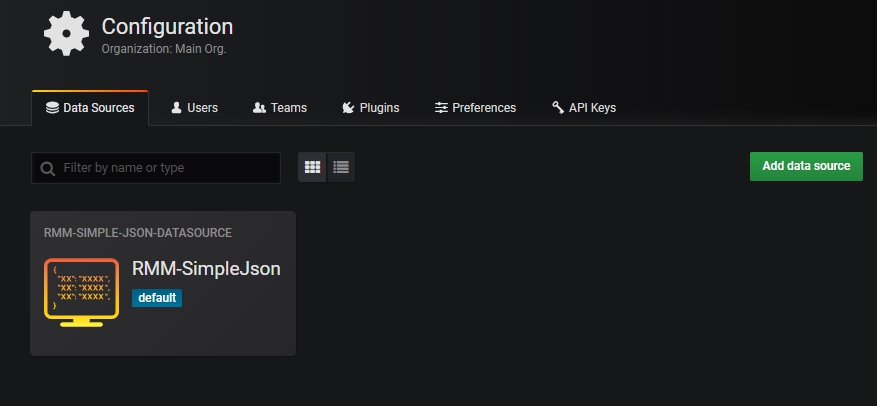
Choose Configuration -> Data Source -> RMM-SimpleJson
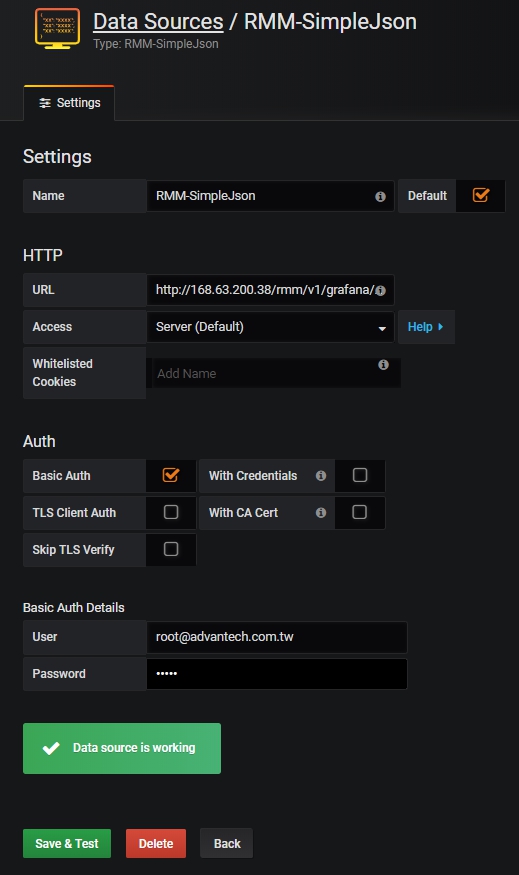
Edit settings as follow
|
Name: RMM-SimpleJson HTTP Access: Server (default) Auth Basic Auth Details |
How To Create A New Gantt Panel
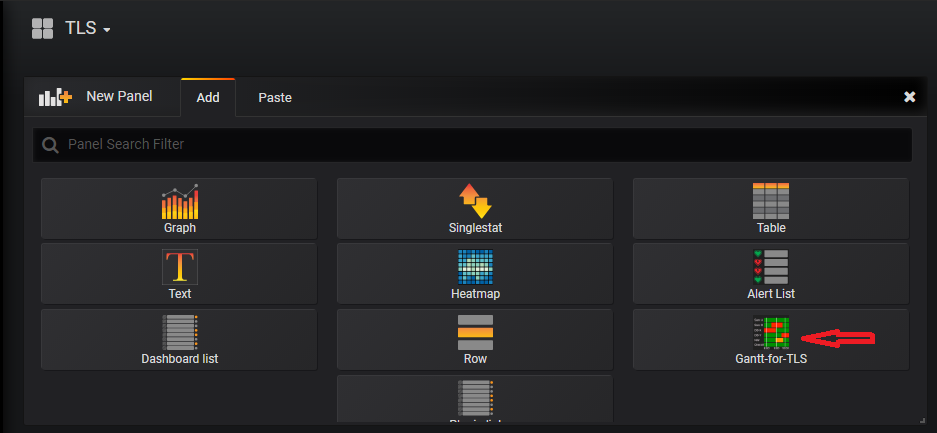
 Step 1: Add panel and choose plugin "Gantt-for-TLS" see Figure 1.
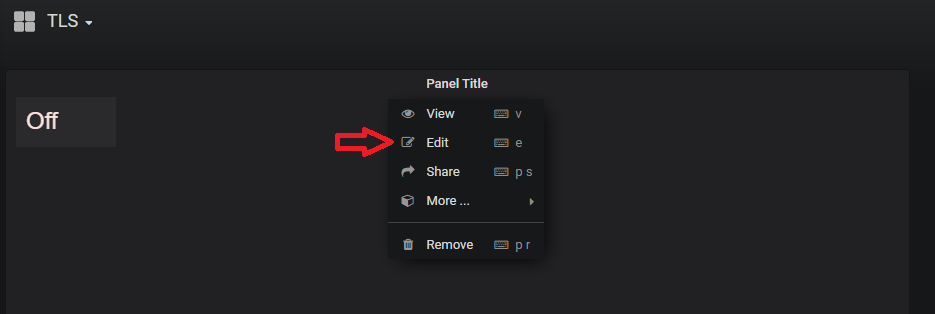
 Step 2: Edit panel see Figure 2.
 Step 3: Set up Metrics and choose DataSource "RMM-SimpleJson".
 Step 4: Set up all of the sensor's(Light1、Light2、Light3、Light4) "Device" "Plugin" "Sensor" "Alias" see Figure 3.
*Warning: Although the sensor light can define the mapping color but the aliases must be these strings "red" "yellow" "green" "blue".
(Figure 1 、 Add Panel)
(Figure 2 、 Edit Panel)
(Figure 3 、 Set Metrics)
Customizable
Options
- You can set up the status text from option1~option5 from Figure 5 .
- You can set up the label text from option10 from Figure 6 .
- "Row Height option6" can change panel's heigh.
- "Text Size option7" can change status text's size.
- "Med Space option8" can Change the distance between Label and Status.
- "Header Indent option9" can change the header's width.
(Figure 4 、 Options Step)
(Figure 5 、 Status Text)
(Figure 6 、 Label Text)
Colors
- "Status Text" can change status text's color from 1 see Figure 7 .
- "Red/Yellow/Green/Blue Light" can change light's color from 2 ~ 6 see Figure 7 .
(Figure 7 、 Colors Mapping)
Export CSV File
Options
- Please select the appropriate time range see Figure 8 .
- Click the Export CSV see Figure 9 .
(Figure 8 、 Grafana Time Range)
(Figure 9 、 Export CSV)
** Notice **
It will be recorded when the status changes
(Figure 10 、 CSV File Example)
Release
| Index | Version | Date | OS |
Release Note |
Download Link |
| 1 | 1.0.0 | 2019-11-1 | windows | First Release |
[1] |
| 2 | 1.0.1 | 2020-2-3 | windows |
Add two Feature 1. Med Space 2. Header Indent |
[2] |
| 3 |
1.0.2 |
2021-7-22 | windows |
Add export csv | [3] |

