Difference between revisions of "Gantt-chart-for-TLS"
| Line 35: | Line 35: | ||
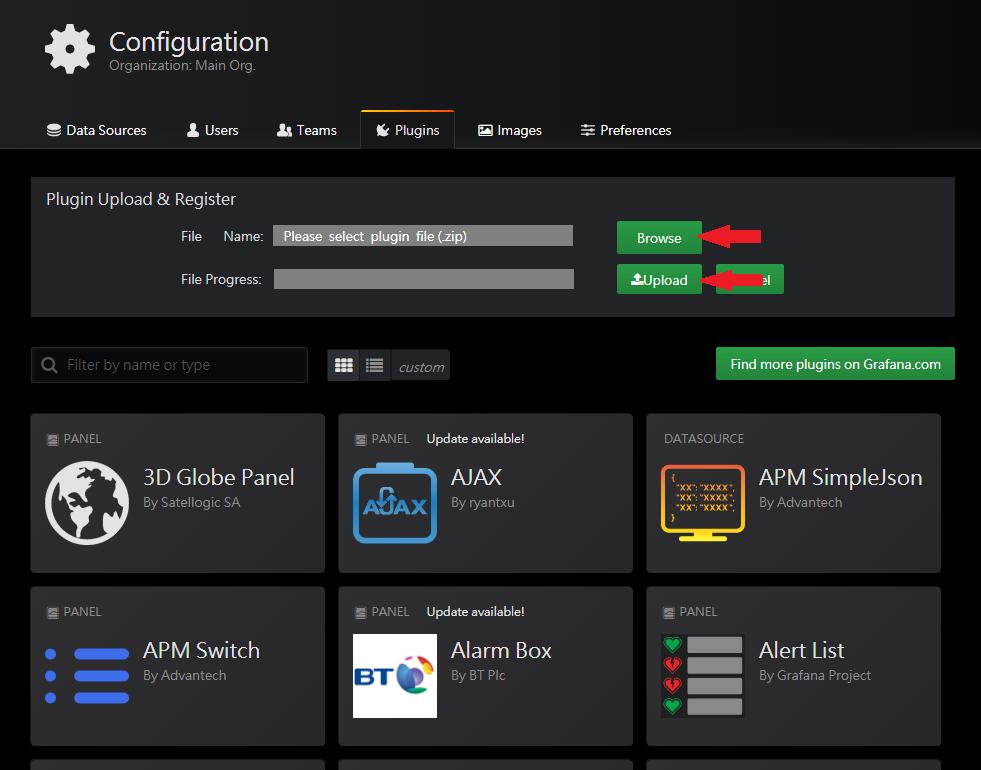
Step 1: Add "gantt-chart-for-tls-panel.zip" see Figure 1. | Step 1: Add "gantt-chart-for-tls-panel.zip" see Figure 1. | ||
Step 2: DataSource "rmm-simple-json-datasource.zip" also refers to step 1. | Step 2: DataSource "rmm-simple-json-datasource.zip" also refers to step 1. | ||
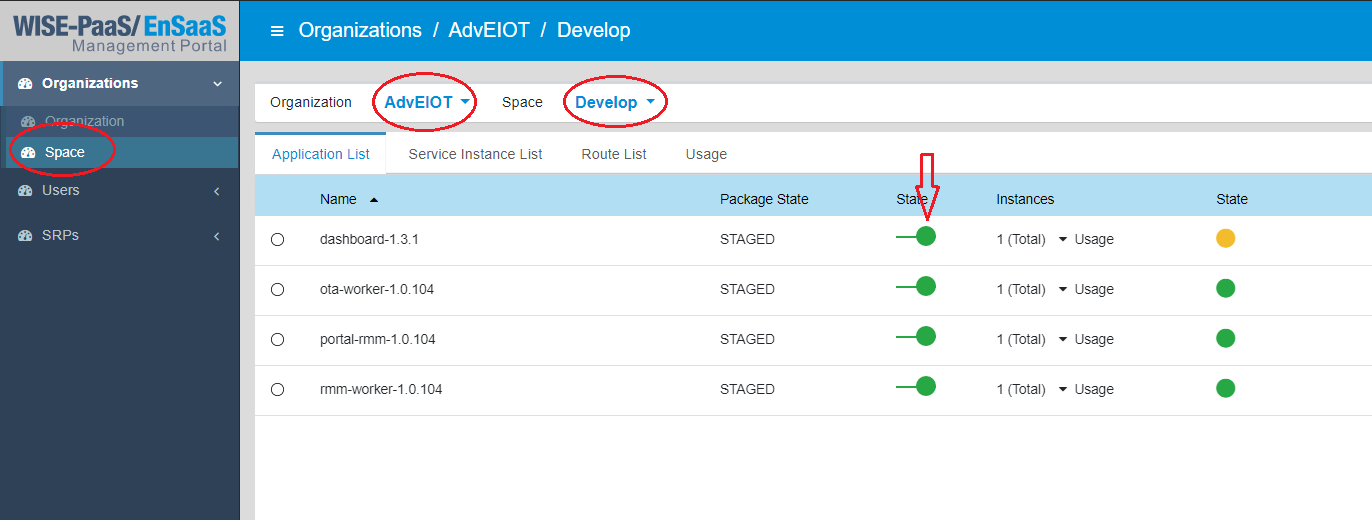
| − | Step 3: Restart Grafana Server. | + | Step 3: Restart Grafana Server see Figure 2. |
| − | [[File:TLS-AddPluginByConfig.PNG]] | + | [[File:TLS-AddPluginByConfig.PNG|RTENOTITLE]] |
(Figure 1 、Add Plugin By Configuration) | (Figure 1 、Add Plugin By Configuration) | ||
| + | [[File:TLS-restart.PNG]] | ||
| − | + | (Figure 2 、Restart) | |
| − | |||
= Set Up Data Source By Grafana = | = Set Up Data Source By Grafana = | ||
Revision as of 06:34, 28 October 2019
Contents
Gannt Panel For TLS
Introduction
This is a customized Gantt chart for the TLS project. The diagram has following features.
- Can gets TLS data in period and shows color bar with priority display rule.
- Can set customize status text from option.
- Direction of time axis: from Left (past) to Right (present).
- Can set color (Red, Yellow, Green, Blue) mapping to light sensor ID (Light1, Light2, Light3, Light4) by TLS.
- Can define timeline period on Gantt chart.
Grafana Version
This Project is base on Grafana v5.3.0 .
Install Plugin Of Panel
 Step 1: Add "gantt-chart-for-tls-panel.zip" see Figure 1.
 Step 2: DataSource "rmm-simple-json-datasource.zip" also refers to step 1.
 Step 3: Restart Grafana Server see Figure 2.
(Figure 1 、Add Plugin By Configuration)
(Figure 2 、Restart)
Set Up Data Source By Grafana
 Step 1: Open "Configuration".
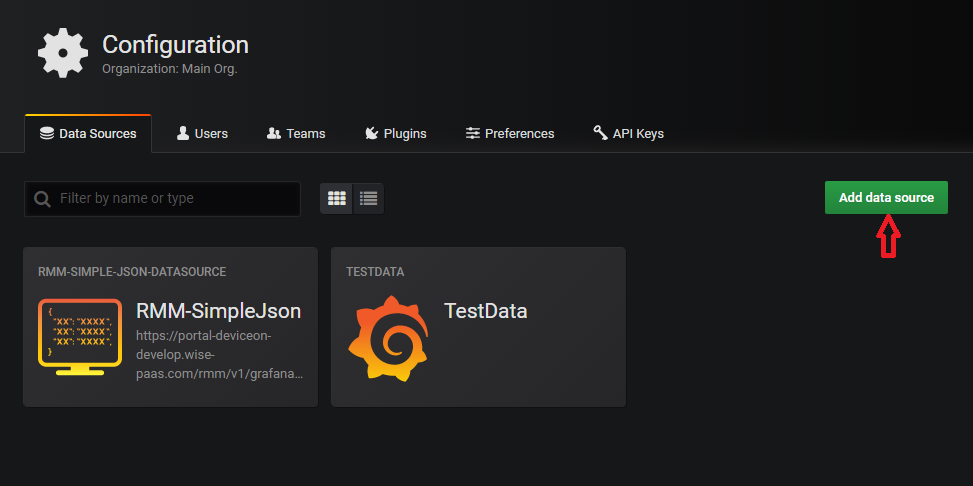
 Step 2: Add new data source see Figure 2.
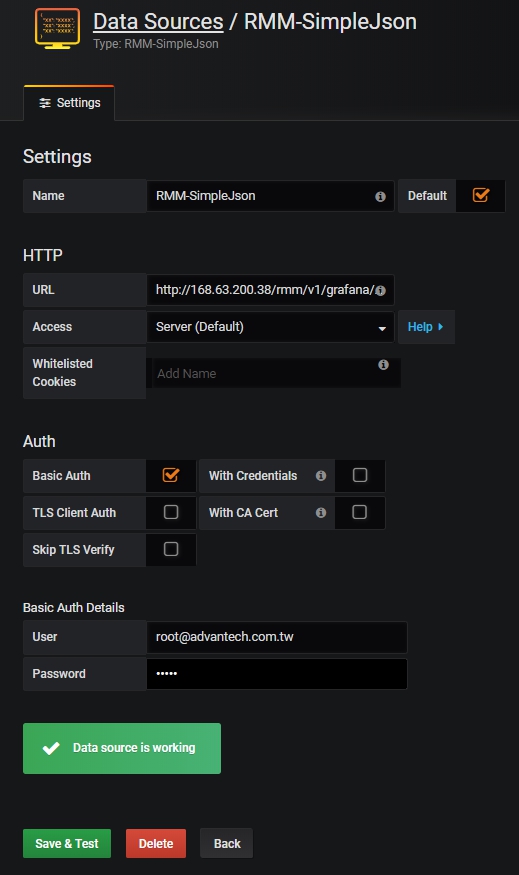
 Step 3: Fill in the information see Figure 3.
(Figure 2 、Configuration)
(Figure 3 、 Set Up DataSource)
|
Name: RMM-SimpleJson HTTP Auth Basic Auth Details |
How To Create A New Gantt Panel
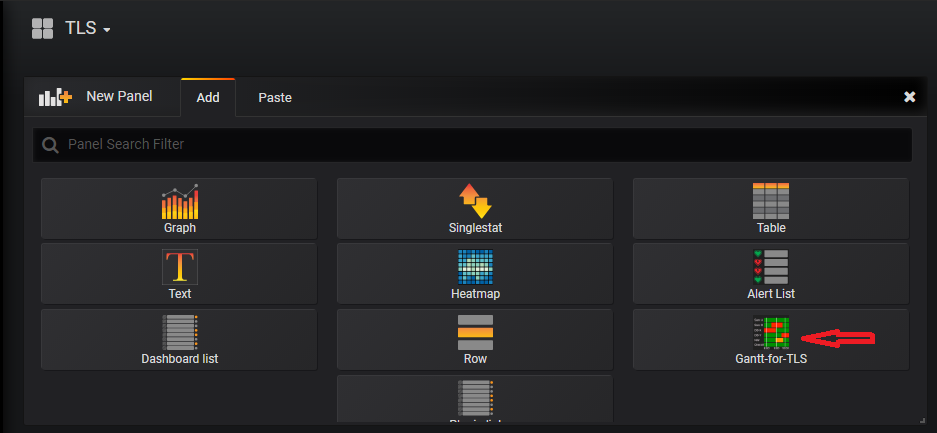
 Step 1: Add panel and choose plugin "Gantt-for-TLS" see Figure 4.
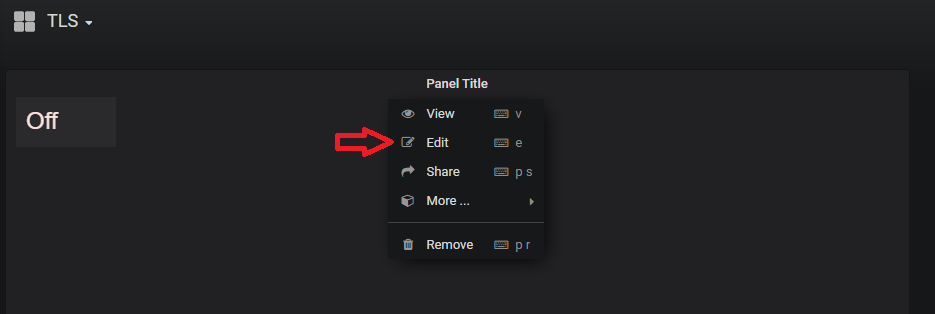
 Step 2: Edit panel see Figure 5.
 Step 3: Set up Metrics and choose DataSource "RMM-SimpleJson".
 Step 4: Set up all of the sensor's(Light1、Light2、Light3、Light4) "Device" "Plugin" "Sensor" "Alias" see Figure 6.
*Warning: Although the sensor light can define the mapping color but the aliases must be these strings "red" "yellow" "green" "blue".
(Figure 4 、 Add Panel)
(Figure 5 、 Edit Panel)
(Figure 6 、 Set Metrics)
|
In Data Source, choose RMM-SimpleJson. In Device, choose Device Id for Tower Light Sensor module. In Plugin, choose SenHub. In Sensor, choose SenData/Light1~SenData/Light4
|
Customizable
Options
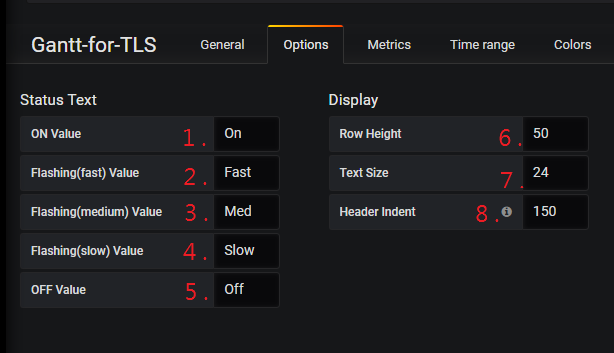
- You can set up the status text from option1~option5 see Figure 7 and it will change the title from Figure 8 .
- "Row Height" can change panel's height from option6 .
- "Text Size" can change status text's size from option7 .
- "Header Indent" can change the header's width from option8 .
(Figure 7 、 Options Step)
(Figure 8 、 Status Text)
Colors
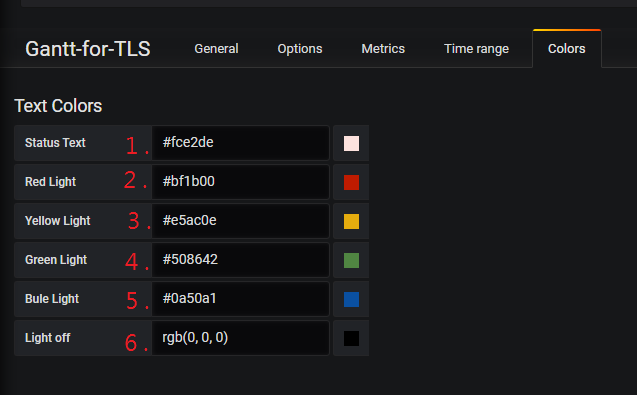
- "Status Text" can change status text's color from 1 see Figure 9 .
- "Red/Yellow/Green/Blue Light" can change light's color from 2 ~ 6 see Figure 9 .
(Figure 9 、 Colors Mapping)
Release
This is an overview that displays Modbus Service versions and some stats and numbers for each release.
| Index | Version | Date | OS |
Release Note |
|
|
| 1 | 1.0.0_rc | 2019-10-22 | windows | First Release |
|

