Difference between revisions of "Gantt-chart-for-TLS"

From ESS-WIKI
Jump to: navigation, search
 
(25 intermediate revisions by 2 users not shown)
Line 1: Line 1:
 
= Gannt Panel For TLS =
 
= Gannt Panel For TLS =
  
[[File:Gantt.PNG|RTENOTITLE]]
+
[[File:Portal.PNG|RTENOTITLE]]
 +
 
 +


Line 16: Line 18:
 
#Can set color (Red, Yellow, Green, Blue) mapping to light sensor ID (Light1, Light2, Light3, Light4) by TLS.
 
#Can set color (Red, Yellow, Green, Blue) mapping to light sensor ID (Light1, Light2, Light3, Light4) by TLS.
 
#Can define timeline period on Gantt chart.
 
#Can define timeline period on Gantt chart.
 +
#The timeline will be displayed below the Gantt chart.
 +
#Gantt chart can set customize label name.
 +
 +
  
  
Line 31: Line 37:
  
  
= Install Plugin Of Panel   =
 
  
  Step 1: Add "gantt-chart-for-tls-panel.zip" see Figure 1.
 
  Step 2: Restart Grafana Server see Figure 2.


[[File:TLS-AddPluginByConfig.PNG|RTENOTITLE]]
+
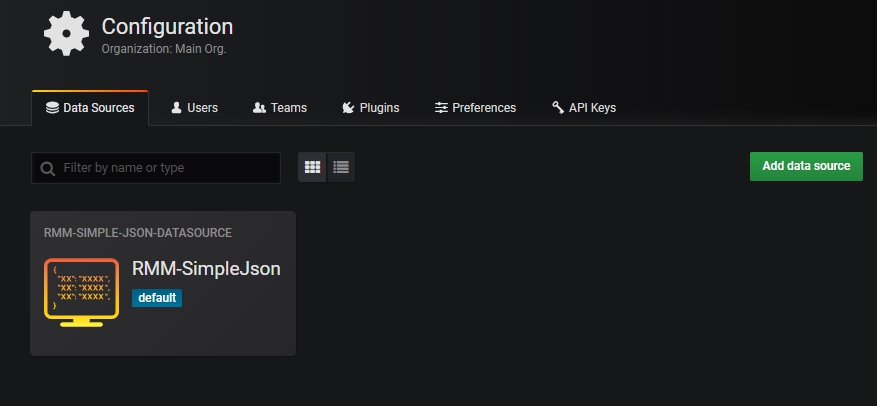
= How To Add RMM-SimpleJSON DataSource =
  
                                                                                                             (Figure 1 、Add Plugin By Configuration) 
+
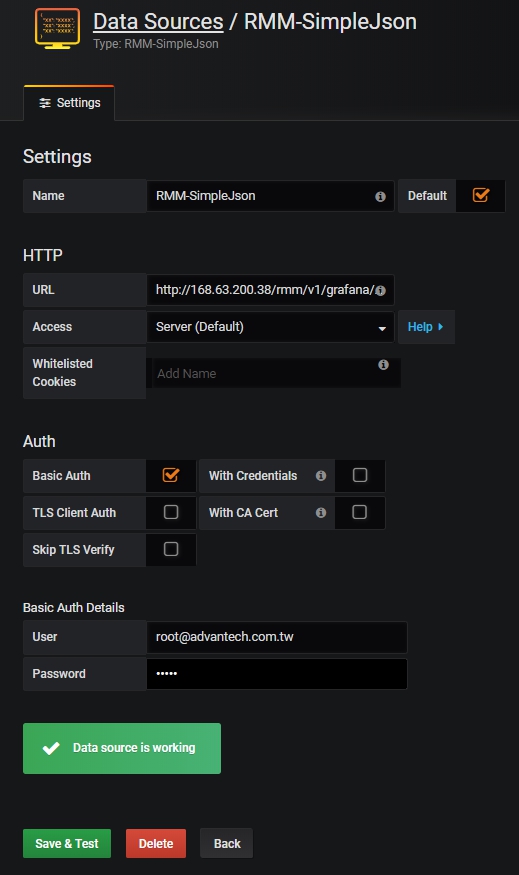
Choose Configuration -> Data Source -> RMM-SimpleJson
  
[[File:TLS-restart.PNG|RTENOTITLE]]
+
[[File:Tower Light create data source1.jpg|RTENOTITLE]]
  
                                                                                                                                                                               (Figure 2 、Restart) 
+
Edit settings as follow
  
 +
[[File:Tower Light create data source2.jpg|RTENOTITLE]]
  
 +
{| border="1" cellspacing="1" cellpadding="1" style="width:500px;"
 +
|-
 +
|
 +
Name: RMM-SimpleJson
  
 +
HTTP<br/>URL: [http://168.63.200.38/rmm/v1/grafana/simplejson/ http://168.63.200.38/rmm/v1/grafana/simplejson/]<br/><span style="color:#FF0000;">* Notice:&nbsp;you&nbsp;need to change url for your EdgeSense url . For example,&nbsp;[https://edgesense.wise-paas.com/rmm/v1/grafana/simplejson/ https://edgesense.wise-paas.com/rmm/v1/grafana/simplejson/]</span>
  
 +
Access: Server (default)
  
= How To Create A New Gantt Panel =
+
Auth<br/>Basic Auth&nbsp;: V
  
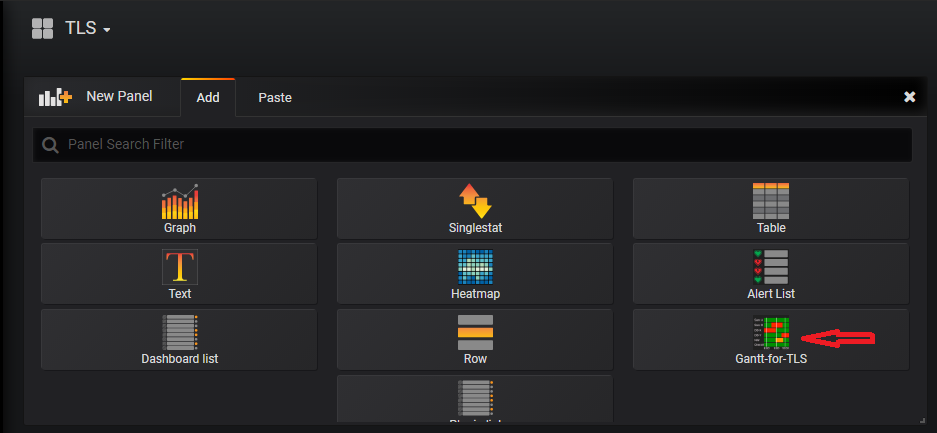
  Step 1: Add panel and choose plugin "Gantt-for-TLS" see Figure 5.
+
Basic Auth Details<br/>User: xxx<br/>Password:&nbsp; xxx<br/><span style="color:#FF0000;">* Notice: you need to assign user and password for your EdgeSense authentication.</span>
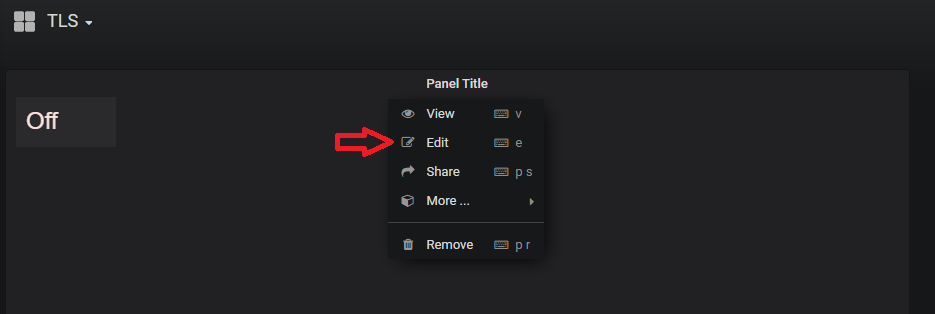
  Step 2: Edit panel see Figure 6.
 
  Step 3: Set up Metrics and choose DataSource "RMM-SimpleJson".
 
  Step 4: Set up all of the sensor's(Light1、Light2、Light3、Light4) "Device" "Plugin" "Sensor" "Alias" see Figure 7.  
 
  
&nbsp; &nbsp; &nbsp; <span style="color:#FF0000;">*Warning: Although the sensor light can define the mapping color but the aliases must be these strings "red" "yellow" "green" "blue".</span>
+
|}
  
  
Line 63: Line 70:
  
  
 +
= How To Create A New Gantt Panel =
  
 +
  Step 1: Add panel and choose plugin "Gantt-for-TLS" see Figure 1.
 +
  Step 2: Edit panel see Figure 2.
 +
  Step 3: Set up Metrics and choose DataSource "RMM-SimpleJson".
 +
  Step 4: Set up all of the sensor's(Light1、Light2、Light3、Light4) "Device" "Plugin" "Sensor" "Alias" see Figure 3.
  
[[File:TLS-Panel.PNG|RTENOTITLE]]&nbsp; &nbsp; &nbsp; &nbsp; &nbsp; &nbsp; &nbsp; &nbsp; &nbsp;
+
&nbsp; &nbsp; &nbsp; <span style="color:#FF0000;">*Warning: Although the sensor light can define the mapping color but the aliases must be these strings "red" "yellow" "green" "blue".</span>
  
&nbsp; &nbsp; &nbsp; &nbsp; &nbsp; &nbsp; &nbsp; &nbsp; &nbsp; &nbsp; &nbsp; &nbsp; &nbsp; &nbsp; &nbsp; &nbsp; &nbsp; &nbsp; &nbsp; &nbsp; &nbsp; &nbsp; &nbsp; &nbsp; &nbsp; &nbsp; &nbsp; &nbsp; &nbsp; &nbsp; &nbsp; &nbsp; &nbsp; &nbsp; &nbsp; &nbsp; &nbsp; &nbsp; &nbsp; &nbsp; &nbsp; &nbsp; &nbsp; &nbsp; &nbsp; &nbsp; &nbsp; &nbsp; &nbsp; &nbsp; &nbsp; (Figure 5&nbsp;、 Add Panel)


Line 73: Line 84:
  
  
[[File:TLS-EditButton.PNG|RTENOTITLE]]
 
  
&nbsp; &nbsp; &nbsp; &nbsp; &nbsp; &nbsp; &nbsp; &nbsp; &nbsp; &nbsp; &nbsp; &nbsp; &nbsp; &nbsp; &nbsp; &nbsp; &nbsp; &nbsp; &nbsp; &nbsp; &nbsp; &nbsp; &nbsp; &nbsp; &nbsp; &nbsp; &nbsp; &nbsp; &nbsp; &nbsp; &nbsp; &nbsp; &nbsp; &nbsp; &nbsp; &nbsp; &nbsp; &nbsp; &nbsp; &nbsp; &nbsp; &nbsp; &nbsp; &nbsp; &nbsp; &nbsp; &nbsp; &nbsp; &nbsp; &nbsp; &nbsp; &nbsp; (Figure 6&nbsp;、 Edit Panel)&nbsp;
+
[[File:TLS-Panel.PNG|RTENOTITLE]]&nbsp; &nbsp; &nbsp; &nbsp; &nbsp; &nbsp; &nbsp; &nbsp; &nbsp;
  
 +
&nbsp; &nbsp; &nbsp; &nbsp; &nbsp; &nbsp; &nbsp; &nbsp; &nbsp; &nbsp; &nbsp; &nbsp; &nbsp; &nbsp; &nbsp; &nbsp; &nbsp; &nbsp; &nbsp; &nbsp; &nbsp; &nbsp; &nbsp; &nbsp; &nbsp; &nbsp; &nbsp; &nbsp; &nbsp; &nbsp; &nbsp; &nbsp; &nbsp; &nbsp; &nbsp; &nbsp; &nbsp; &nbsp; &nbsp; &nbsp; &nbsp; &nbsp; &nbsp; &nbsp; &nbsp; &nbsp; &nbsp; &nbsp; &nbsp; &nbsp; &nbsp; (Figure 1&nbsp;、 Add Panel)


[[File:TLS-Metrics.PNG|RTENOTITLE]]
 
  
&nbsp; &nbsp; &nbsp; &nbsp; &nbsp; &nbsp; &nbsp; &nbsp; &nbsp; &nbsp; &nbsp; &nbsp; &nbsp; &nbsp; &nbsp; &nbsp; &nbsp; &nbsp; &nbsp; &nbsp; &nbsp; &nbsp; &nbsp; &nbsp; &nbsp; &nbsp; &nbsp; &nbsp; &nbsp; &nbsp; &nbsp; &nbsp; &nbsp; &nbsp; &nbsp; &nbsp; &nbsp; &nbsp; &nbsp; &nbsp; &nbsp; &nbsp; &nbsp; &nbsp; &nbsp; &nbsp; &nbsp; &nbsp; &nbsp; &nbsp; &nbsp; &nbsp; &nbsp; &nbsp; &nbsp; &nbsp; &nbsp; &nbsp; &nbsp; &nbsp; &nbsp; &nbsp; &nbsp; &nbsp; &nbsp; &nbsp; &nbsp; &nbsp; &nbsp; &nbsp; &nbsp; &nbsp; &nbsp; &nbsp; &nbsp; (Figure 7&nbsp;、 Set Metrics)
+
[[File:TLS-EditButton.PNG|RTENOTITLE]]
  
{| border="1" cellspacing="1" cellpadding="1" style="width: 598px;"
+
&nbsp; &nbsp; &nbsp; &nbsp; &nbsp; &nbsp; &nbsp; &nbsp; &nbsp; &nbsp; &nbsp; &nbsp; &nbsp; &nbsp; &nbsp; &nbsp; &nbsp; &nbsp; &nbsp; &nbsp; &nbsp; &nbsp; &nbsp; &nbsp; &nbsp; &nbsp; &nbsp; &nbsp; &nbsp; &nbsp; &nbsp; &nbsp; &nbsp; &nbsp; &nbsp; &nbsp; &nbsp; &nbsp; &nbsp; &nbsp; &nbsp; &nbsp; &nbsp; &nbsp; &nbsp; &nbsp; &nbsp; &nbsp; &nbsp; &nbsp; &nbsp; &nbsp; (Figure 2&nbsp;、 Edit Panel)&nbsp;
|-
 
| style="width: 591px;" |
 
In Data Source,&nbsp;choose RMM-SimpleJson.
 
  
​In Device, choose Device Id for Tower Light Sensor module.
 
  
In Plugin, choose SenHub.
 
  
In Sensor,&nbsp;choose SenData/Light1~SenData/Light4


 +
[[File:TLS-Metrics.PNG|RTENOTITLE]]
  
 +
&nbsp; &nbsp; &nbsp; &nbsp; &nbsp; &nbsp; &nbsp; &nbsp; &nbsp; &nbsp; &nbsp; &nbsp; &nbsp; &nbsp; &nbsp; &nbsp; &nbsp; &nbsp; &nbsp; &nbsp; &nbsp; &nbsp; &nbsp; &nbsp; &nbsp; &nbsp; &nbsp; &nbsp; &nbsp; &nbsp; &nbsp; &nbsp; &nbsp; &nbsp; &nbsp; &nbsp; &nbsp; &nbsp; &nbsp; &nbsp; &nbsp; &nbsp; &nbsp; &nbsp; &nbsp; &nbsp; &nbsp; &nbsp; &nbsp; &nbsp; &nbsp; &nbsp; &nbsp; &nbsp; &nbsp; &nbsp; &nbsp; &nbsp; &nbsp; &nbsp; &nbsp; &nbsp; &nbsp; &nbsp; &nbsp; &nbsp; &nbsp; &nbsp; &nbsp; &nbsp; &nbsp; &nbsp; &nbsp; &nbsp; &nbsp; (Figure 3&nbsp;、 Set Metrics)
  
  
|}
 
  
 +
= Customizable =
  
 +
&nbsp; &nbsp; &nbsp;&nbsp;<span style="font-size:large;">Options</span>
  
 +
*You can set up the status text from option1~option5 from Figure 5&nbsp;.
 +
*You can set up the label text from option10&nbsp;from Figure 6&nbsp;.
 +
*"Row Height option6" can change panel's heigh.
 +
*"Text Size option7" can change status text's size.
 +
*"Med Space option8" can Change the distance between Label and Status.
 +
*"Header Indent option9" can change the header's width.


 +
[[File:Tls-opt-v2.PNG|RTENOTITLE]]
  
 +
&nbsp; &nbsp; &nbsp; &nbsp; &nbsp; &nbsp; &nbsp; &nbsp; &nbsp; &nbsp; &nbsp; &nbsp; &nbsp; &nbsp; &nbsp; &nbsp; &nbsp; &nbsp; &nbsp; &nbsp; &nbsp; &nbsp; &nbsp; &nbsp; &nbsp; &nbsp; &nbsp; &nbsp; &nbsp; &nbsp; &nbsp; &nbsp; &nbsp; &nbsp; &nbsp; &nbsp; &nbsp; &nbsp; &nbsp; &nbsp; &nbsp; &nbsp; &nbsp; &nbsp; &nbsp; &nbsp; &nbsp; &nbsp; &nbsp; &nbsp; &nbsp; &nbsp; &nbsp; &nbsp; &nbsp; (Figure 4&nbsp;、 Options Step)
  
 +
[[File:Status-v2.PNG|RTENOTITLE]]
  
 +
&nbsp; &nbsp; &nbsp; &nbsp; &nbsp; &nbsp; &nbsp; &nbsp; &nbsp; &nbsp; &nbsp; &nbsp; &nbsp; &nbsp; &nbsp; &nbsp; &nbsp; &nbsp; &nbsp; &nbsp; &nbsp; &nbsp; &nbsp; &nbsp; &nbsp; &nbsp; &nbsp; &nbsp; &nbsp; &nbsp; &nbsp; &nbsp; &nbsp; &nbsp; &nbsp; &nbsp; &nbsp; &nbsp; &nbsp; &nbsp; &nbsp; &nbsp; &nbsp; &nbsp; &nbsp; &nbsp; &nbsp; &nbsp; &nbsp; &nbsp; &nbsp; &nbsp; &nbsp; &nbsp; &nbsp; &nbsp; &nbsp; &nbsp; &nbsp; &nbsp; &nbsp; &nbsp; &nbsp; &nbsp; &nbsp; &nbsp; &nbsp; &nbsp; &nbsp; &nbsp;(Figure 5&nbsp;、 Status Text)
  
 +
[[File:Label-v2.png|RTENOTITLE]]
  
 +
&nbsp; &nbsp; &nbsp; &nbsp; &nbsp; &nbsp; &nbsp; &nbsp; &nbsp; &nbsp; &nbsp; &nbsp; &nbsp; &nbsp; &nbsp; &nbsp; &nbsp; &nbsp; &nbsp; &nbsp; &nbsp; &nbsp; &nbsp; &nbsp; &nbsp; &nbsp; &nbsp; &nbsp; &nbsp; &nbsp; &nbsp; &nbsp; &nbsp; &nbsp; &nbsp; &nbsp; &nbsp; &nbsp; &nbsp; &nbsp; &nbsp; &nbsp; &nbsp; &nbsp; &nbsp; &nbsp; &nbsp; &nbsp; &nbsp; &nbsp; &nbsp; &nbsp; &nbsp; &nbsp; &nbsp; &nbsp; &nbsp; &nbsp; &nbsp; &nbsp; &nbsp; &nbsp; &nbsp; &nbsp; &nbsp; &nbsp; &nbsp; &nbsp; &nbsp; &nbsp;(Figure 6&nbsp;、 Label Text)
  
 +
&nbsp; &nbsp; &nbsp;&nbsp;<span style="font-size:large;">Colors</span>
  
 +
*"Status Text" can change&nbsp; status text's color&nbsp; from 1 see Figure 7&nbsp;.
 +
*"Red/Yellow/Green/Blue Light" can change&nbsp; light's color&nbsp;from 2 ~ 6&nbsp;see Figure 7&nbsp;.
  
 +
[[File:TLS-color.PNG|RTENOTITLE]]
  
 +
&nbsp; &nbsp; &nbsp; &nbsp; &nbsp; &nbsp; &nbsp; &nbsp; &nbsp; &nbsp; &nbsp; &nbsp; &nbsp; &nbsp; &nbsp; &nbsp; &nbsp; &nbsp; &nbsp; &nbsp; &nbsp; &nbsp; &nbsp; &nbsp; &nbsp; &nbsp; &nbsp; &nbsp; &nbsp; &nbsp; &nbsp; &nbsp; &nbsp;(Figure 7&nbsp;、 Colors Mapping)
  
 
+
= Export CSV File =
= Customizable =


&nbsp; &nbsp; &nbsp;&nbsp;<span style="font-size:large;">Options</span>
 
&nbsp; &nbsp; &nbsp;&nbsp;<span style="font-size:large;">Options</span>
  
*&nbsp;You can set up the status text from option1~option5 see Figure 8&nbsp;and it will change the title from Figure 9&nbsp;.
+
*Please select the appropriate time range&nbsp;see Figure 8&nbsp;.
*"Row Height" can change panel's height from option6&nbsp;.
+
*Click the Export CSV&nbsp;see Figure 9&nbsp;.
*"Text Size" can change status text's size from option7&nbsp;.
 
*"Header Indent" can change the header's width from option8&nbsp;.
 
  
 +
[[File:Grafana Timerange.PNG|RTENOTITLE]]
  
 +
&nbsp; &nbsp; &nbsp; &nbsp; &nbsp; &nbsp; &nbsp; &nbsp; &nbsp; &nbsp; &nbsp; &nbsp; &nbsp; &nbsp; &nbsp; &nbsp; &nbsp; &nbsp; &nbsp; &nbsp; &nbsp; &nbsp; &nbsp; &nbsp; &nbsp; &nbsp; &nbsp; &nbsp; &nbsp; &nbsp; &nbsp; &nbsp; &nbsp; &nbsp; &nbsp; &nbsp; &nbsp; &nbsp; &nbsp; &nbsp; &nbsp; &nbsp; &nbsp; &nbsp; &nbsp; &nbsp; &nbsp; &nbsp; &nbsp; &nbsp; &nbsp; &nbsp; &nbsp; &nbsp; &nbsp; &nbsp; &nbsp; &nbsp; &nbsp; &nbsp; &nbsp; &nbsp; &nbsp; &nbsp; &nbsp; &nbsp; &nbsp; &nbsp; &nbsp; &nbsp; &nbsp; &nbsp; &nbsp; &nbsp; &nbsp;(Figure 8&nbsp;、 Grafana Time Range)
  
[[File:Option.PNG|RTENOTITLE]]
+
[[File:Grafana Exportcsv2.PNG|RTENOTITLE]]
  
&nbsp; &nbsp; &nbsp; &nbsp; &nbsp; &nbsp; &nbsp; &nbsp; &nbsp; &nbsp; &nbsp; &nbsp; &nbsp; &nbsp; &nbsp; &nbsp; &nbsp; &nbsp; &nbsp; &nbsp; &nbsp; &nbsp; &nbsp; &nbsp; &nbsp; &nbsp; &nbsp; &nbsp; &nbsp; &nbsp;(Figure 8&nbsp;、 Options Step)
 
  
[[File:TLS-Status-Text.PNG|RTENOTITLE]]
 
  
&nbsp; &nbsp; &nbsp; &nbsp; &nbsp; &nbsp; &nbsp; &nbsp; &nbsp; &nbsp; &nbsp; &nbsp; &nbsp; &nbsp; &nbsp; &nbsp; &nbsp; &nbsp; &nbsp; &nbsp; &nbsp; &nbsp; &nbsp; &nbsp; &nbsp; &nbsp; &nbsp; &nbsp; &nbsp; &nbsp; &nbsp; &nbsp; &nbsp; &nbsp; &nbsp; &nbsp; &nbsp; &nbsp; &nbsp; &nbsp; &nbsp; &nbsp; &nbsp; &nbsp; &nbsp; &nbsp; &nbsp; &nbsp; &nbsp; &nbsp; &nbsp; &nbsp; &nbsp; &nbsp; &nbsp; (Figure 9&nbsp;、 Status Text)
+
&nbsp; &nbsp; &nbsp; &nbsp; &nbsp; &nbsp; &nbsp; &nbsp; &nbsp; &nbsp; &nbsp; &nbsp; &nbsp; &nbsp; &nbsp; &nbsp; &nbsp; &nbsp; &nbsp; &nbsp; &nbsp; &nbsp; &nbsp; &nbsp; &nbsp; &nbsp; &nbsp; &nbsp; &nbsp; &nbsp; &nbsp; &nbsp; &nbsp; &nbsp; &nbsp; &nbsp; &nbsp; &nbsp; &nbsp; &nbsp; &nbsp; &nbsp; &nbsp; &nbsp; &nbsp; &nbsp; &nbsp; &nbsp; &nbsp; &nbsp; &nbsp; &nbsp; &nbsp; &nbsp; &nbsp; &nbsp; &nbsp; &nbsp; &nbsp; &nbsp; &nbsp; &nbsp; &nbsp; &nbsp; &nbsp; &nbsp; &nbsp; &nbsp; &nbsp;(Figure 9&nbsp;、 Export&nbsp;CSV)
  
&nbsp; &nbsp; &nbsp;&nbsp;<span style="font-size:large;">Colors</span>
+
<span style="color:#FF0000;">** Notice **</span>
  
*"Status Text" can change&nbsp; status text's color&nbsp; from 1 see Figure 10&nbsp;.
+
<span style="color:#FF0000;">It will be recorded when the status changes</span>
*"Red/Yellow/Green/Blue Light" can change&nbsp; light's color&nbsp;from 2 ~ 6&nbsp;see Figure 10&nbsp;.
 
  
[[File:TLS-color.PNG|RTENOTITLE]]
+
&nbsp; &nbsp;[[File:Grafana Csv.PNG|RTENOTITLE]]
  
&nbsp; &nbsp; &nbsp; &nbsp; &nbsp; &nbsp; &nbsp; &nbsp; &nbsp; &nbsp; &nbsp; &nbsp; &nbsp; &nbsp; &nbsp; &nbsp; &nbsp; &nbsp; &nbsp; &nbsp; &nbsp; &nbsp; &nbsp; &nbsp; &nbsp; &nbsp; &nbsp; &nbsp; &nbsp; &nbsp; &nbsp; &nbsp; &nbsp;(Figure 10&nbsp;、 Colors Mapping)
+
&nbsp; &nbsp; &nbsp; &nbsp; &nbsp;&nbsp;(Figure 10&nbsp;、 CSV File Example)
  
 +
= Release =
  
 +
{| border="1" cellspacing="1" cellpadding="1" style="width: 546px;"
 +
|-
 +
| style="width: 36px;" | Index
 +
| style="width: 54px;" | Version
 +
| style="width: 78px;" | Date
 +
| style="width: 56px;" | OS<br/>
 +
| style="width: 188px;" | Release Note<br/>
 +
| style="width: 101px;" | Download Link<br/>
 +
|-
 +
| style="width: 36px;" | 1
 +
| style="width: 54px;" | 1.0.0
 +
| style="width: 78px;" | 2019-11-1
 +
| style="width: 56px;" | windows
 +
| style="width: 188px;" | First Release<br/>
 +
| style="width: 101px;" |
 +
[file://EOSSFS/ESS-Release/EdgeSense/Release/Windows/EnOcean/Gannt-Chart-For-TLS/Release/1.0.0/grafana-plugin/grafana-plugin.zip [1]]
  
+
|-
 
+
| style="width: 36px;" | 2
 +
| style="width: 54px;" | 1.0.1
 +
| style="width: 78px;" | 2020-2-3
 +
| style="width: 56px;" | windows
 +
| style="width: 188px;" |
 +
Add two Feature
  
 +
1.&nbsp;Med Space
  
= Release =
+
2. Header Indent
  
This is an overview that displays Modbus Service&nbsp;versions and some stats and numbers for each release.
+
| style="width: 101px;" |
 +
[file://EOSSFS/ESS-Release/EdgeSense/Release/Windows/EnOcean/Gannt-Chart-For-TLS/Release/1.0.1/grafana-plugin/grafana-plugin.zip [2]]
  
{| border="1" cellspacing="1" cellpadding="1" style="width: 571px;"
 
 
|-
 
|-
| Index
+
| style="width: 36px;" | 3
| style="width: 53px;" | Version
+
| style="width: 54px;" |  
| style="width: 80px;" | Date
+
1.0.2
| style="width: 56px;" | OS<br/>
+
 
| style="width: 91px;" | Release Note<br/>
+
| style="width: 78px;" | 2021-7-22
| style="width: 118px;" | Download Link<br/>
+
| style="width: 56px;" | windows<br/>
|-
+
| style="width: 188px;" | Add export csv
| 1
+
| style="width: 101px;" | [file://EOSSFS/ESS-Release/EdgeSense/Release/Windows/EnOcean/Gannt-Chart-For-TLS/Release/1.0.2/grafana-plugin/grafana-plugin.zip [3]]<br/>
| style="width: 53px;" | 1.0.0_rc
 
| style="width: 80px;" | 2019-10-22
 
| style="width: 56px;" | windows
 
| style="width: 91px;" | First Release<br/>
 
| style="width: 118px;" | <br/>
 
 
|}
 
|}

Latest revision as of 05:27, 23 August 2021

Gannt Panel For TLS

RTENOTITLE


Introduction

This is a customized Gantt chart for the TLS project. The diagram has following features.

  1. Can gets TLS data in period and shows color bar with priority display rule.
  2. Can set customize status text from option.
  3. Direction of time axis: from Left (past) to Right (present).
  4. Can set color (Red, Yellow, Green, Blue) mapping to light sensor ID (Light1, Light2, Light3, Light4) by TLS.
  5. Can define timeline period on Gantt chart.
  6. The timeline will be displayed below the Gantt chart.
  7. Gantt chart can set customize label name.


Grafana Version

This Project is base on Grafana v5.3.0 .


How To Add RMM-SimpleJSON DataSource

Choose Configuration -> Data Source -> RMM-SimpleJson

RTENOTITLE

Edit settings as follow

RTENOTITLE

Name: RMM-SimpleJson

HTTP
URL: http://168.63.200.38/rmm/v1/grafana/simplejson/
* Notice: you need to change url for your EdgeSense url . For example, https://edgesense.wise-paas.com/rmm/v1/grafana/simplejson/

Access: Server (default)

Auth
Basic Auth : V

Basic Auth Details
User: xxx
Password:  xxx
* Notice: you need to assign user and password for your EdgeSense authentication.


How To Create A New Gantt Panel

 Step 1: Add panel and choose plugin "Gantt-for-TLS" see Figure 1.
 Step 2: Edit panel see Figure 2.
 Step 3: Set up Metrics and choose DataSource "RMM-SimpleJson".
 Step 4: Set up all of the sensor's(Light1、Light2、Light3、Light4) "Device" "Plugin" "Sensor" "Alias" see Figure 3. 

      *Warning: Although the sensor light can define the mapping color but the aliases must be these strings "red" "yellow" "green" "blue".


RTENOTITLE                 

                                                                                                      (Figure 1 、 Add Panel)


RTENOTITLE

                                                                                                        (Figure 2 、 Edit Panel) 


RTENOTITLE

                                                                                                                                                      (Figure 3 、 Set Metrics)


Customizable

      Options

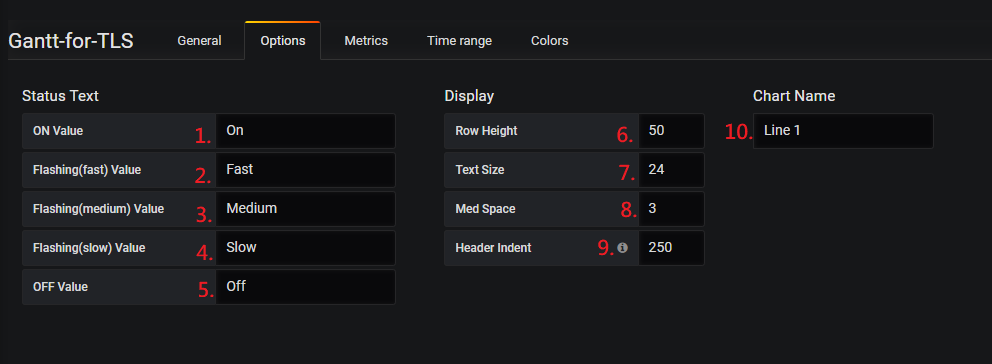
  • You can set up the status text from option1~option5 from Figure 5 .
  • You can set up the label text from option10 from Figure 6 .
  • "Row Height option6" can change panel's heigh.
  • "Text Size option7" can change status text's size.
  • "Med Space option8" can Change the distance between Label and Status.
  • "Header Indent option9" can change the header's width.


RTENOTITLE

                                                                                                              (Figure 4 、 Options Step)

RTENOTITLE

                                                                                                                                           (Figure 5 、 Status Text)

RTENOTITLE

                                                                                                                                           (Figure 6 、 Label Text)

      Colors

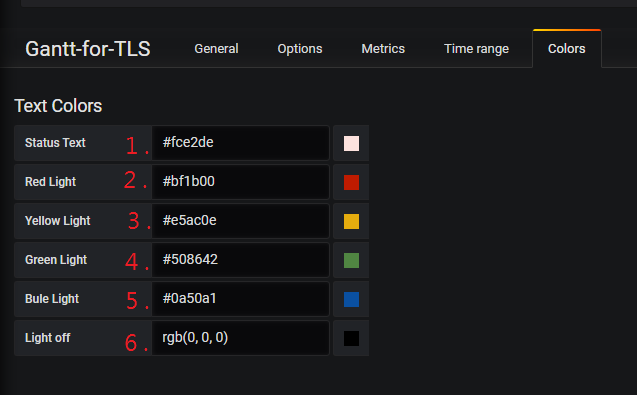
  • "Status Text" can change  status text's color  from 1 see Figure 7 .
  • "Red/Yellow/Green/Blue Light" can change  light's color from 2 ~ 6 see Figure 7 .

RTENOTITLE

                                                                 (Figure 7 、 Colors Mapping)

Export CSV File

      Options

  • Please select the appropriate time range see Figure 8 .
  • Click the Export CSV see Figure 9 .

RTENOTITLE

                                                                                                                                                     (Figure 8 、 Grafana Time Range)

RTENOTITLE


                                                                                                                                         (Figure 9 、 Export CSV)

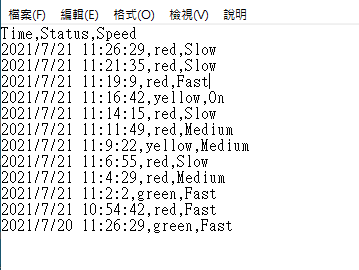
** Notice **

It will be recorded when the status changes

   RTENOTITLE

          (Figure 10 、 CSV File Example)

Release

Index Version Date OS
Release Note
Download Link
1 1.0.0 2019-11-1 windows First Release

[1]

2 1.0.1 2020-2-3 windows

Add two Feature

1. Med Space

2. Header Indent

[2]

3

1.0.2

2021-7-22 windows
Add export csv [3]