Edge AI SDK/AI Framework/OpenVINO
Contents
OpenVINO
OpenVINO™ toolkit: An open-source solution for optimizing and deploying AI inference, in domains such as computer vision, automatic speech recognition, natural language processing, recommendation systems, and more. With its plug-in architecture, OpenVINO allows developers to write once and deploy anywhere. We are proud to announce the release of OpenVINO 2023.0 introducing a range of new features, improvements, and deprecations aimed at enhancing the developer experience.
- Enables the use of models trained with popular frameworks, such as TensorFlow and PyTorch.
- Optimizes inference of deep learning models by applying model retraining or fine-tuning, like post-training quantization.
- Supports heterogeneous execution across Intel hardware, using a common API for the Intel CPU, Intel Integrated Graphics, Intel Discrete Graphics, and other commonly used accelerators.
OpenVINO Runtime SDK
Overall updates
- Proxy & hetero plugins have been migrated to API 2.0, providing enhanced compatibility and stability.
- Symbolic shape inference preview is now available, leading to improved performance for LLMs.
- OpenVINO's graph representation has been upgraded to opset12, introducing a new set of operations that offer enhanced functionality and optimizations.
- NPU Device Plugin support.
Applications
Edge AI SDK / Vision Application
| Application | Model |
| Object Detection | yolox |
| Person Detection | person-detection-retail-0013 |
| Face Detection | faceboxes-pytorch |
| Pose Estimation | human-pose-estimation-0001 |
Edge AI SDK / GenAI Application
| Application | Model |
| Chatbot | Llama-3.1-8b-instruct |
Benchmark
You can refer the link to test the performance with the benchmark_app
benchmark_app
The OpenVINO benchmark setup includes a single system with OpenVINO™, as well as the benchmark application installed. It measures the time spent on actual inference (excluding any pre or post processing) and then reports on the inferences per second (or Frames Per Second).
You can refer : link
Examples
cd /opt/Advantech/EdgeAISuite/Intel_Standard/benchmark
<CPU>
$ ./benchmark_app -m ../model/mobilenet-ssd/FP16/mobilenet-ssd.xml -i car.png -t 8 -d CPU
<iGPU>
$ ./benchmark_app -m ../model/mobilenet-ssd/FP16/mobilenet-ssd.xml -i car.png -t 8 -d GPU
<NPU>
$ ./benchmark_app -m ../model/mobilenet-ssd/FP16/mobilenet-ssd.xml -i car.png -t 8 -d NPU
Utility
XPU-SIM
Intel® XPU Manager ( offical link ) is a free and open-source solution for local and remote monitoring and managing Intel® Data Center GPUs. It is designed to simplify administration, maximize reliability and uptime, and improve utilization.
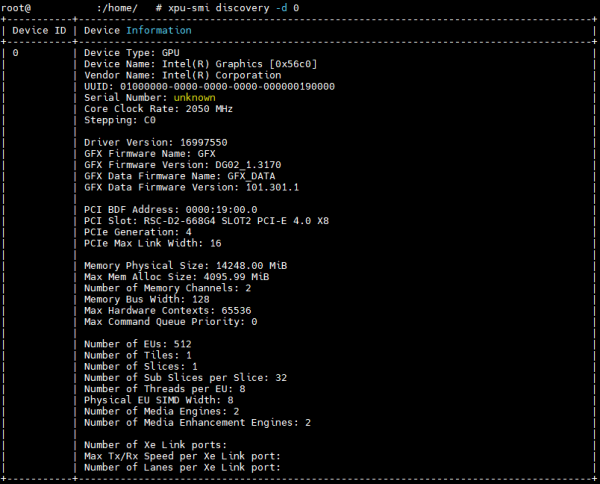
Intel XPU System Management Interface (SMI) A command line utility for local XPU management.
Key features
Monitoring GPU utilization and health, getting job-level statistics, running comprehensive diagnostics, controlling power, policy management, firmware updating, and more.
Show GPU basic information , sample below
You can refer more info xpu-smi
intel-gpu-tools
Intel GPU Tools is a collection of tools for development and testing of the Intel DRM driver. There are many macro-level test suites that get used against the driver, including xtest, rendercheck, piglit, and oglconform, but failures from those can be difficult to track down to kernel changes, and many require complicated build procedures or specific testing environments to get useful results. Therefore, Intel GPU Tools includes low-level tools and tests specifically for development and testing of the Intel DRM Driver.
Show GPU basic information , sample below
$ sudo intel_gpu_top
SoC-Watch
Use Intel® SoC Watch to perform energy analysis on a Linux*, Windows*, or Android* system running on Intel® architecture. Study power consumption in the system and identify behaviors that waste energy. Intel SoC Watch generates a summary text report or you can import results into Intel® VTune™ Profiler.
Show NPU basic information , sample below
$ sudo ./socwatch -t 1 -f npu
You can refer more info Soc-Watch


